The following module is a demonstration of some simple aspects of the GraphPaper library.
MODULE TestGraph;

(* by Joel Schwartz 1998 06 12 to test GraphPaper
revised 1998 07 11 by R. Sutcliffe. *)

FROM GraphPaper IMPORT
  AngleType, CoordSystem, SetCoordSystem, SetAngleType, SetLabels, SetScale,
  ShowAxes, ShowLabels, PlotPoint, PolarPlotPoint, TurnTo, LineBy,
  LineTo, MoveTo, Turn, Home;

FROM RealMath IMPORT
  pi, sin;

VAR
  counter : INTEGER;
  x, y : REAL;

PROCEDURE DrawSquare (side : INTEGER);
(* draws a square of the given side length starting at the current angle; concludes with the same position and angle as it started *)
VAR
  Count : CARDINAL;
BEGIN
  SetAngleType (rad);
  FOR Count := 1 TO 4
    DO
      LineBy (side);
      Turn (pi/2.0);
    END;
  SetAngleType (deg);
END DrawSquare;

BEGIN
  (* Set up the axes *)
  SetCoordSystem (standard); (* use mathematical system *)
  SetLabels ('X', 'Y');
  SetScale (1); (* one dot per division *)
  ShowAxes;
  ShowLabels;

  (* Test the scaled point plotting routines *)
  (* Sine curve *)
  FOR counter := -4000 TO 4000
    DO
      x := FLOAT (counter)/100.0;
      y := sin (x);
      PlotPoint (x, y);
    END;

  (* Circle of radius 5 units with a point at every unit degree angle *)
  FOR counter := 1 TO 360
    DO
       PolarPlotPoint (5.0, FLOAT (counter));
    END;

  (* Angled line *)
  FOR counter := 1 TO 300
    DO
       PolarPlotPoint (FLOAT (counter)/10.0 ,10.0);
    END;

  (* Test the pixel plotting routines *)
  Home;
  TurnTo (30.0);
  LineBy (200);
  LineTo (200, -100);
  LineBy (100);

  (* Make a square *)
  TurnTo (0.0);
  DrawSquare (75);

  SetCoordSystem (MacWin); (* use Mac system *)
  MoveTo (0, 0);
  TurnTo (60.0);
  LineBy (250); (* should come from top left corner *)

  SetCoordSystem (bearing); (* use bearing system *)
  MoveTo (-60, -60);
  Turn (225.0);
  LineBy (150); (* should be in bottom left quadrant *)

END TestGraph.
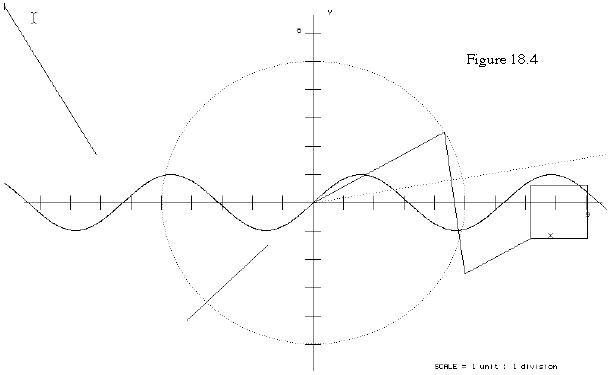
The reader should verify the correctness of each routine in the following (much reduced) screen shot of the output.